Who will lead your company when it matters most?
Identify, develop, and prepare your future leaders before you need them. Individual career plans with three recommendation sources, algorithmic ranking for every key position, and native integration with 9-Box and People Analytics.
3 sources
of recommendation
0–100%
algorithm score
executive export
Ana García
Senior Analyst · Finance
Performance
Potential
Next Step
CFO · Finance Division
Ana García
Carlos López
María Torres
Juan Martínez
The cost of not planning
73%
of LATAM companies don't have a formal succession plan for their key positions.
It's not a lack of willingness — it's a lack of tools. Without cross-referenced data on performance, potential, and career trajectory, succession ends up being an informal executive conversation or a last-minute external search.
Reactive approach
The key position becomes vacant and only then does the search begin. It takes months to fill a critical role.
Tenure-based decisions
The most senior person gets promoted, not the most prepared. Unmapped potential stays invisible.
Talent flight risk
High-potential employees leave because they don't see a clear growth path in the company.
Stale succession plans
The succession spreadsheet is 18 months old and nobody remembers who built it.
How it works
From open position to ideal successor
in three steps.
Define the position to succeed
HR selects the combination of level and area (and optionally sub-area and country). One click to start the search.
Search filters
Senior Manager · Finance · Colombia
The algorithm processes the data
MyDNA analyzes all employees using their performance, potential, level, and career history data.
Model variables
Performance · Potential · Level · Area · History
Get the ranked list
Candidates sorted by score (0–100%). Manually reorder as needed and export as PDF.
Exportable list
#1 Ana García 94% · #2 Carlos López 87%…
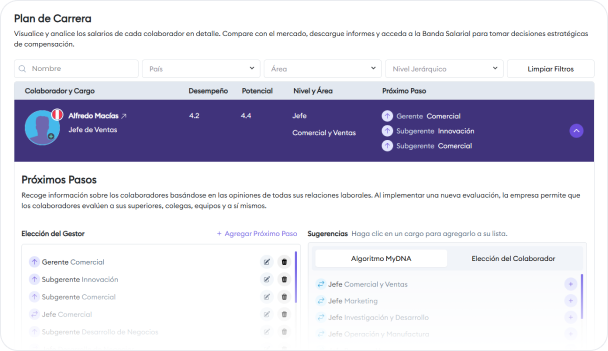
Career Plan
Three perspectives on the next step. One informed decision.
Each employee's career plan integrates the manager's vision, the employee's own aspirations, and the algorithm's objective recommendation. All three sources coexist so HR can make the best development decision.
Manager
The direct manager indicates what they consider the best next step for the employee.
Employee
The employee registers their preference or career aspiration within the company.
MyDNA Algorithm
The model cross-references performance, potential, level, and area to suggest the best available match.
Data visible per employee
Employee Mandala
Nine data dimensions. One profile for talent decisions.
The Mandala is the individual hub where MyDNA modules converge. Talent & Succession reads these indicators to rank candidates and enrich each career plan without duplicating information.
Professional history
Career path and experience that contextualize readiness for larger roles.
Purpose
Alignment between what the person seeks and what the organization can offer.
Education
Degrees and certifications that support the move to more demanding positions.
Cultural profile
Fit with the four cultures (Commercial, Disruptive, Collaborative, Traditional) for mobility decisions.
Competencies
Assessment Center results with behavioral strengths and gaps.
Motivations
What keeps talent engaged and reduces flight risk during succession.
Performance and potential
Evaluation-cycle scores crossed with level, area, and trajectory.
9-Box position
Performance × potential quadrant updated at each cycle close—no parallel spreadsheets.
Training and career plan
Completed learning and next steps (manager, employee, and algorithm) in one place.
9-Box matrix
Performance and potential in a grid that updates itself.
MyDNA places each employee on the 3×3 matrix by crossing performance and potential from the evaluation cycle. When the cycle closes, quadrants are recalculated automatically—no need to re-enter scores elsewhere.
- Vertical axis: potential assessed in the Performance module.
- Horizontal axis: performance observed in the same cycle.
- 9-Box placement appears in the Mandala and feeds succession rankings.
- Ideal for calibrations and talent conversations with a shared language.
Potential (vertical axis)
Performance (horizontal axis)
Illustrative labels; naming may vary based on your company configuration.
Succession Plan
The ranking that turns data into executive decisions.
Define the level and area of the position to succeed. The algorithm generates a ranked list of the most prepared candidates in seconds, with 0–100% scores and all performance and potential data visible.
- 🔍Filters by level, area, sub-area, and country
- ⚡Algorithm-generated ranking in seconds
- ↕️Manual ranking reordering by HR
- 📊0–100% score with performance and potential data
- 📄PDF export for executive presentations
- 🔄Ranking regeneration at any time
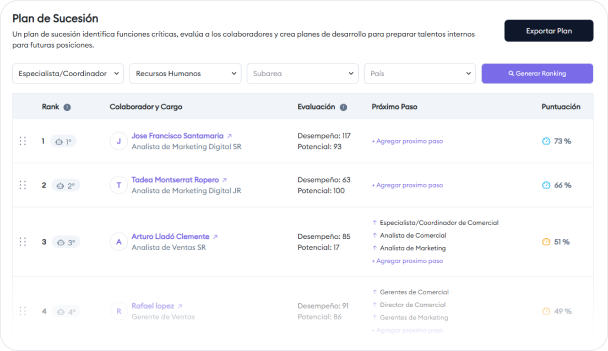
Each row in the ranking
What you see per candidate before deciding succession.
Aligned with the Succession Plan in the platform: list position, evaluation, next steps, and algorithmic score in one place.
List rank and algorithm rank
Model-suggested order and final position after HR manual adjustment.
Name and position
Clear identification of the employee and current role versus the role to succeed.
Evaluation
Performance and potential scores that contextualize readiness for the move.
Next steps
Recommended development or mobility to close gaps before the transition.
0–100% score
Single score summarizing algorithmic fit with the strategic role profile.
Actions
Generate list, manually reorder, and export PDF for committee or board.
Connected to the data ecosystem you already have.
Talent & Succession doesn't operate in silos. It reads data generated in Performance and People Analytics so every ranking reflects the current reality of your organization.
Performance 9-Box
Performance and potential scores from your evaluation cycle feed the succession algorithm automatically, keeping the ranking current after every cycle.
Auto-syncPeople Analytics
Turnover, engagement, and internal mobility data enrich each candidate's profile, making the ranking more precise and context-aware.
Enriched dataContinuous Updates
Every completed evaluation, every role change, and every level adjustment are reflected instantly in career plans and succession lists.
Real-timeProven results
The difference between planning and reacting.
3×
faster to identify the ideal successor vs. manual process
60%
reduction in critical vacancies without internal coverage
2×
higher retention of high-potential talent with active career plans
20+
LATAM countries with integrated performance and salary data
Designed for
Every role involved in talent development.
CEO & Board
- Visibility on who can step into critical roles
- Reduce key-person dependency
- Promotion decisions backed by data
- Strategic talent planning 2–3 years out
CHRO & HR Leadership
- Complete map of internal talent and potential
- Standardized and auditable succession process
- Integration with performance cycles and 9-box
- Exportable executive reports in PDF
HR Business Partner
- Individualized career plans per employee
- Conversation tool for 1:1 meetings
- Talent pipeline visibility by area
- Alerts for employees without a defined plan
Managers & Leaders
- Propose the next step for each team member
- Understand the real potential of your talent
- Identify who is ready for more responsibility
- Build resilient teams in the face of turnover
Frequently asked questions
What people ask before activating the first plan.
How does the algorithm rank succession candidates?
⌄
MyDNA's algorithm cross-references performance, potential, level, area, and career history to generate a 0–100% score. The ranking can be manually reordered by HR and exported to PDF for executive presentations.
Can managers propose their own candidates for succession?
⌄
Yes. The career plan includes three recommendation sources: the direct manager's input, the employee's own preference, and the algorithm's recommendation. All three coexist to provide a complete picture.
Does Talent & Succession integrate with the Performance 9-box?
⌄
Yes. Performance and potential scores generated in the evaluation cycle feed directly into the succession module, so the ranking always reflects the most recent 9-box data.
How often should the succession plan be updated?
⌄
We recommend reviewing plans at the close of each evaluation cycle (annual or semi-annual) and whenever there is movement in a key position. MyDNA allows you to regenerate the ranking at any time with one click.
What happens when a critical position has no internal candidates?
⌄
The algorithm displays the scores of the available pool and flags when no candidate exceeds the confidence threshold. This allows HR to plan ahead for an external search or accelerated development of talent close to the required profile.
How does the Employee Mandala feed Talent & Succession?
⌄
The Mandala centralizes data from active modules: history, education, culture, Assessment Center competencies and motivations, performance and potential with 9-Box, training, career plan, and insights. That single view feeds the succession algorithm without duplicate spreadsheets.
How does the automatic 9-Box matrix work?
⌄
The 3×3 matrix crosses performance and potential from the evaluation cycle. When the cycle closes, quadrants are recalculated automatically and the result appears in the Mandala and in succession rankings—no re-entry of scores in another tool.
How does HR define a strategic position in the Succession Plan?
⌄
HR selects the level and area of the role to succeed (and optionally sub-area and country). With those filters the algorithm generates the ranked list; HR can then reorder, document criteria, and export the PDF for committee review.
How is successor readiness measured?
⌄
Readiness shows in the 0–100% score, performance and potential ratings, 9-Box quadrant, and suggested next development steps to close gaps before transition—so multiple candidates for the same role can be compared objectively.
Have more questions? Let's talk →
Free demo
See in 30 minutes who your key position successors are.
We'll show you how to configure the first succession plan, how the algorithm generates the ranking with your company's data, and how to export the result for a board presentation.