Your company may be losing talent by paying without market data.
MyDNA Compensation compares your salaries against real market data in 14 countries and 70 industries. Generate reports in milliseconds, manage salary bands, and visualize market benefits and emotional salary — all in one platform.
No commitment. Response within 24 hours.
Unit Report
Marketing Manager · Mexico
MXN 45,000
Percentile 25
MXN 65,000
Market median
MXN 85,000
Percentile 75
Market Benefits · Managers
Mexico · TechPerformance bonus
87%
Health insurance
82%
Hybrid remote
76%
Stock options / Equity
54%
The problem
Making salary decisions without market data means managing compensation blindly.
"We lost three senior engineers in six months. All went to companies paying 15–25% more. We thought we were at market — but we were using two-year-old data."
— A common situation in companies of 200–1,000 employees across LATAM
Outdated or nonexistent benchmarks
Annual salary reports in PDF format cost thousands of dollars and arrive months late. By the time HR processes them, the data no longer reflects the market.
No visibility into internal equity
Two people in the same role can earn very different salaries for historical reasons. Without systematic comparison, inequity persists and creates conflict.
Benefits decided without data
What benefits does the market offer for each role? Without structured information, compensation packages are improvised and candidates are lost.
Manual processes that take weeks
Building a competitive salary offer for a new role can take days of manual research. With a 100× faster engine, the same process takes seconds.
How it works
From market data to compensation decisions in minutes.
Four steps that transform how your company defines, compares, and manages compensation — without consultants, without delays.
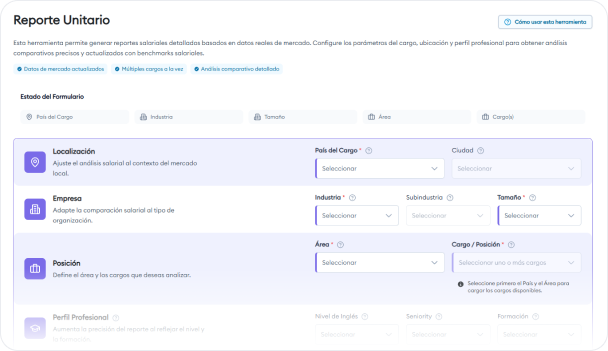
Generate the Unit Report
Select country, industry, area, and position. In milliseconds you get the market benchmark with P25, median, and P75. Generate multiple roles at once.
Compare per employee
Load or sync each person's salary. The platform automatically shows the difference in value and percentage vs. the market midpoint for their position.
Define and manage salary bands
Create bands by seniority level and country. The platform shows who is inside, above, or below their band — and lets you adjust when the market changes.
Analyze the Salary Dashboard
When the Payroll Report closes, the dashboard auto-generates: comparisons by level, by department, and a distribution of employees vs. the market average.
Features
Everything you need to manage compensation with real data.
Unit Report
Salary benchmarks in milliseconds. 14 countries, 70+ industries with sub-industries, filters for language, seniority, education, and company size. Generate multiple roles at once.
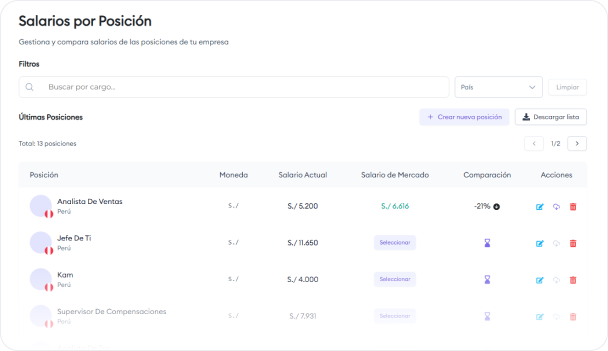
Salaries by Position
Consolidated view of all salaries by role: currency, monthly salary, and market comparison. Exportable for external analysis.
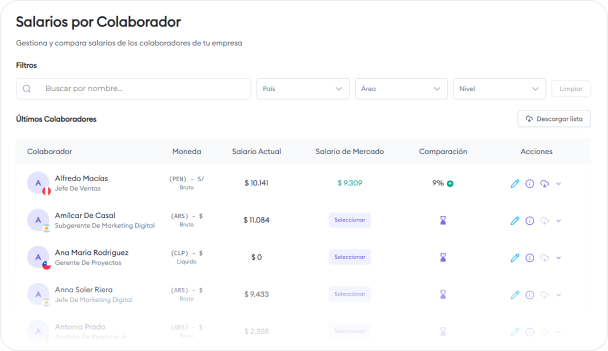
Salaries by Employee
Filterable table by name, country, area, and seniority level. For each person: currency, salary, market difference, and access to their salary band.
Salary Comparison
Graphical visualization of each employee's positioning vs. the market: band level, market midpoint, difference in value and percentage.
Salary Band
Create and manage salary bands by country with configurable values. The platform automatically places each employee within their corresponding band.
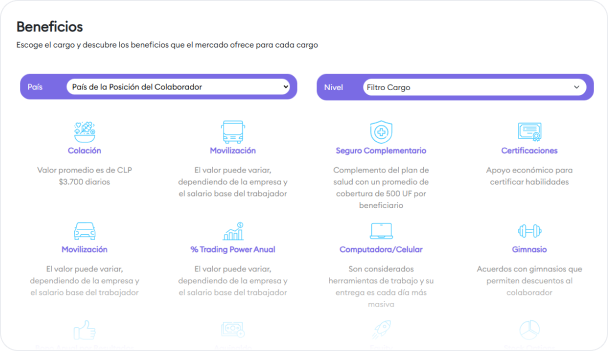
Market Benefits
Find out what benefits the market offers for each role. Filter by country and level: meals, transportation, health insurance, certifications, bonus, aguinaldo, equity, and more.
Emotional Salary
Non-financial benefits the market offers most frequently: flexible hours, hybrid/remote work, early Friday finish, casual dress code, pet-friendly workplace.
Salary Dashboard
Executive dashboard auto-generated after closing the Payroll Report. Company vs. market comparisons by seniority level, by department, and employee distribution.
Variable Compensation
Manage profit sharing (PLR), annual bonuses, commissions, and any variable pay component. Define targets, record results, and calculate variable pay per employee. Visible from the employee self-service portal.
Digital Payslip
Employees access and download their payslips directly from the personal portal, with full monthly history. HR uploads documents in bulk or individually, with per-employee access control.
Benefits & Emotional Salary
Know what the market offers — before losing the candidate.
Benefits determine whether a candidate accepts or declines an offer. MyDNA shows what monetary and non-monetary benefits the market provides for each role and level — by country and industry.
Market Benefits
Filter by country and role level to see what percentage of the market offers each type of benefit. Updated data for evidence-based compensation package decisions.
Market Benefits
Percentage of market offering each benefit
Emotional Salary
Non-financial benefits are increasingly decisive for attracting and retaining talent. MyDNA shows what the market practices most frequently — so your value proposition is competitive beyond salary.
Emotional Salary
Frequency of non-financial benefits in the market
Built for those who make compensation decisions in LATAM.
HR Manager / Director
- ✓Generate benchmarks for any role in seconds
- ✓Present internal equity data to leadership
- ✓Define and update salary bands with real data
- ✓Executive dashboard ready after payroll close
HR Business Partner
- ✓Answer salary inquiries with objective data
- ✓Compare employees against the market without manual work
- ✓Identify who is out-of-band before they resign
- ✓Prepare offer proposals with market-backed arguments
C-Suite / CEO
- ✓Understand company salary positioning vs. market
- ✓Make salary review decisions with evidence
- ✓Reduce turnover caused by non-competitive pay
- ✓Know what benefits to offer to attract key talent
FAQ
What people ask before starting their salary benchmark.
How many countries and industries does the salary benchmark cover?
⌄
The Unit Report covers 14 LATAM countries with their main cities and regions. There are 70+ industries available with the option to select sub-industries for greater benchmark precision.
How often is market data updated?
⌄
Data is updated periodically with information from salary surveys, external sources, and the platform's own data across LATAM. The generation engine is 100× faster, enabling frequent queries without friction.
Can I compare each employee's salary individually?
⌄
Yes. The 'Salaries by Employee' view shows each person's difference in value and percentage vs. the market midpoint for their position. Filter by name, country, area, and seniority level.
How do salary bands work?
⌄
Bands are created and managed in the platform by country and seniority level. You set the values, edit them when the market shifts, and the platform automatically places each employee within their corresponding band.
What does the Market Benefits view include?
⌄
Filter by country and role level to see what percentage of the market offers each benefit type: meals, transportation, health insurance, certifications, performance bonus, aguinaldo, equity, and stock options.
Is the Salary Dashboard auto-generated?
⌄
Yes. The Salary Dashboard is generated automatically after closing the Payroll Report. It shows company vs. market comparisons by seniority level, by department, and a distribution chart of employees vs. the market average — no additional manual work required.
Does MyDNA manage variable compensation like profit sharing and bonuses?
⌄
Yes. The Variable Compensation module lets you define targets, record results, and calculate the variable pay component for profit sharing, annual bonuses, commissions, and any company-configured incentive. Employees see their targets, results, and calculated payout from their personal portal.
Can employees view and download their payslips from the platform?
⌄
Yes. With the Digital Payslip module, HR uploads documents in bulk and each employee accesses their full payslip history from the personal portal. Download is instant as PDF — no need to request the document from HR.
Have more questions? Talk to us →
Free demo
See in 30 minutes how your salary structure compares to the market.
We'll show you a live Unit Report, the per-employee comparison view, salary band configuration, and the executive dashboard. With data from companies like yours in LATAM.
Plataforma en detalle
Todas las funcionalidades en un vistazo